
2026 Market Update (Q2 2026)
Industrial rent in the Inland Empire vs Orange County has repriced since this comparison was first published. Asking rents have come down from their 2022-2023 peak and vacancy has risen in both markets. Here are the latest figures from Kidder Mathews Q2 2026 market reports:
Inland Empire: average asking rate about $0.98 per sq ft per month (NNN), with direct vacancy at 7.6% and total availability of 12.9%. A large construction pipeline (roughly 6.8 million sq ft underway) has added supply as demand cooled.
Orange County: average asking rate about $1.45 per sq ft per month (NNN), down about 5% year over year, with direct vacancy at 6.0% and availability at 9.2%. Orange County stays tighter and pricier than the Inland Empire because of its supply-constrained, infill nature.
The core takeaway of this article still holds: the Inland Empire remains the affordable, large-format logistics option, while Orange County commands a premium for infill space. But both markets have repriced downward from the historic lows of 2022-2023. The detailed comparison below reflects the market at the time of original writing; the figures above are the current Q2 2026 snapshot. Source: Kidder Mathews Inland Empire and Orange County industrial market reports, Q2 2026.
Key Takeaway: Southern California industrial has softened in both submarkets. As of Q2 2026 the Inland Empire asks about $0.98 per sq. ft. per month NNN with 7.6% direct vacancy and 12.9% availability, while Orange County asks about $1.45 NNN with 6.0% direct vacancy and 9.2% availability. Orange County still carries roughly a 48% rent premium, but asking rents are falling in both markets rather than rising.
Southern California’s industrial real estate market continues to shift as demand, vacancy rates, and commercial property pricing evolve between the Inland Empire and Orange County. Both markets are critical to regional growth, one powered by large-scale logistics and the other by high-value infill opportunities and manufacturing facilities.
This market analysis from KEYZ Commercial Real Estate compares current rent levels, vacancy trends, cap rates, and investment potential across both regions. Whether you’re an industrial property owner, commercial real estate investor, or tenant searching for warehouse space or distribution centers, understanding these trends can help you make informed decisions and position your assets effectively for 2026 and beyond.
Inland Empire: Lower Rents, Ample Availability, and a Thinning Pipeline
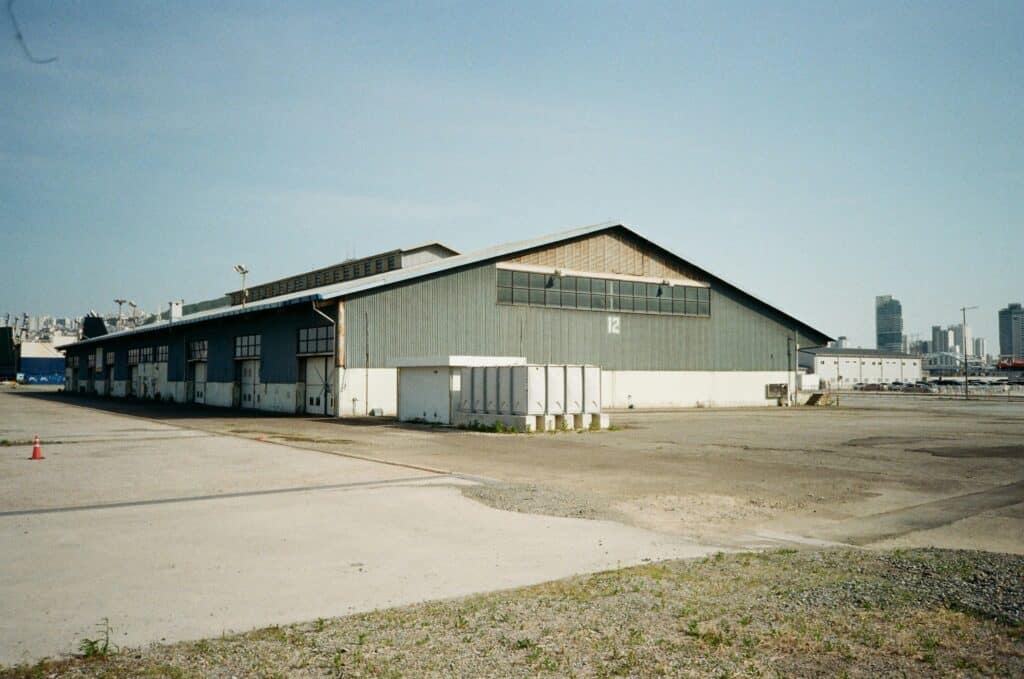
The Inland Empire remains the industrial heart of Southern California and a major logistics hub. Its proximity to the ports of Los Angeles and Long Beach, combined with major interstate access via I-10, I-15, and I-215, continues to attract logistics operators, e-commerce fulfillment centers, third-party logistics (3PL) providers, and distribution tenants.
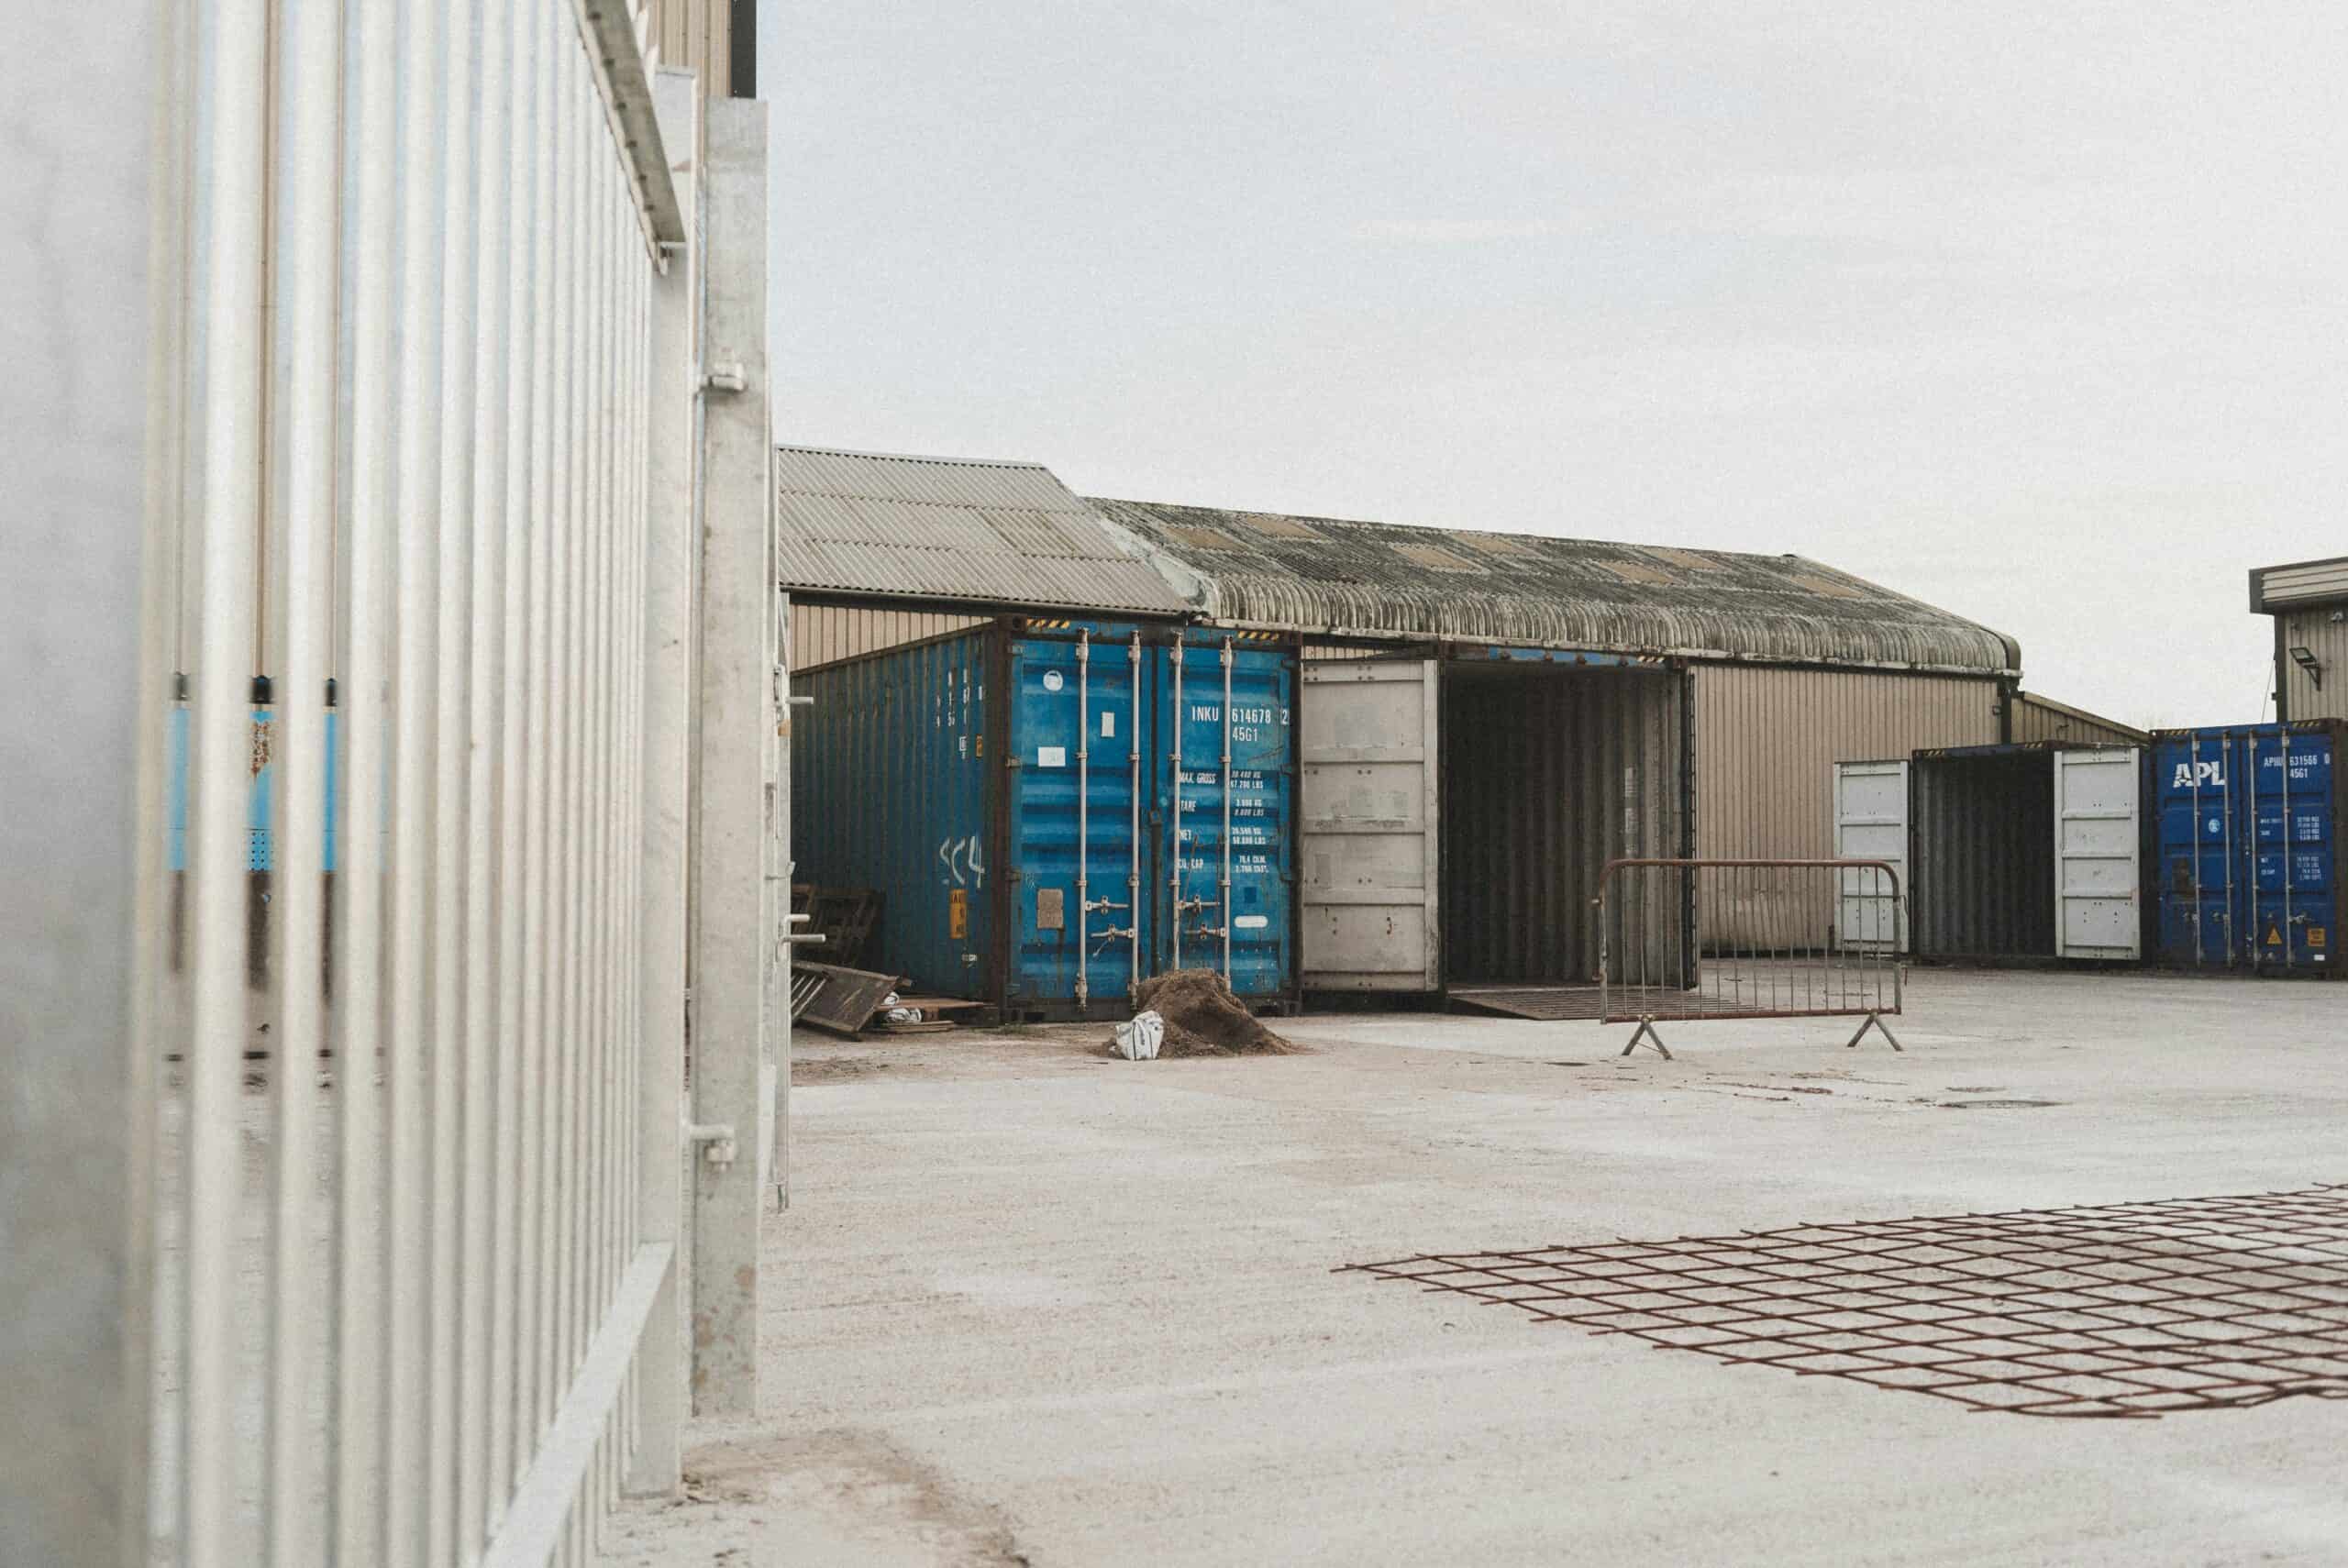
Key Market Indicators
Average Industrial Rent (Q2 2026): $0.98 per sq. ft. per month, triple net (NNN), per Kidder Mathews Q2 2026 Inland Empire Industrial Market Report. Asking rents have declined from their 2022 to 2023 peak.
Vacancy Rate: 7.6% direct and 8.6% including sublease, with total availability at 12.9%, per Kidder Mathews Q2 2026.
Development Pipeline: 6,853,803 sq. ft. under construction as of Q2 2026, with only 296,000 sq. ft. delivered during the quarter, per Kidder Mathews. The pipeline has contracted sharply from its 2024 peak, and space under construction across Southern California fell 32.1% year over year.
Cap Rates: Recorded Southern California industrial trades cleared between roughly 5.26% and 6.65% in mid-2026, per Lee & Associates investment data, a meaningful widening from the sub-5% pricing common in 2021 and 2022.
Property Tax Rates: Generally lower than coastal markets, reducing total occupancy costs for tenants.
Deliveries have slowed sharply, with only 296,000 sq. ft. completed in Q2 2026 against 6.85 million sq. ft. still under construction. Institutional investors, REITs, and brokers remain active in the region, viewing the Inland Empire as a long-term logistics market, though underwriting now assumes a longer lease-up than it did in 2022.
Submarket Spotlight: Ontario, Riverside, and Perris
Ontario Ranch continues to see significant development activity, particularly for large-format distribution centers and cross-dock facilities exceeding 500,000 sq. ft. with high clear height requirements (32-40 feet) and optimal column spacing for modern warehouse operations.
Riverside offers mid-tier pricing with excellent freeway access, attracting manufacturing and regional distribution users seeking dock-high loading facilities and competitive warehouse leasing rates.
Perris provides the most affordable industrial property options in the region, popular with smaller logistics companies, third-party logistics (3PL) providers, and tenants requiring flexible building size requirements.
With availability at 12.9% across the Inland Empire, tenants have more choice in these submarkets than at any point since 2020, and more leverage on tenant improvement allowances and free rent.
Explore Inland Empire Industrial Properties →
Orange County: Limited Supply, Premium Pricing, and Softening Rents
In contrast, Orange County’s industrial market operates under a very different set of dynamics. With limited land availability, strict zoning regulations, and virtually no large-scale new development, the county has become a landlord-favorable, supply-constrained market.
Those zoning regulations are not uniform across the county, and they decide what a tenant can actually open in a given space. Our Anaheim retail zoning and permitting guide works through one city in detail — permitted uses by zone, parking ratios by use, and the conditional use permit path.
[IMAGE 3 – Orange County Industrial]
- File name: orange-county-class-a-industrial-property-irvine.jpg
- Alt text: “Modern Class A industrial building in Orange County near Irvine business district with professional landscaping and executive access”
Key Market Indicators
Average Industrial Rent (Q2 2026): $1.45 per sq. ft. per month NNN, down 5.2% year over year, per Kidder Mathews Q2 2026 Orange County Industrial Market Report.
Vacancy Rate: 6.0% direct, up from 5.8% in Q1 2026, with total availability at 9.2%, per Kidder Mathews Q2 2026. Space above 50,000 sq. ft. remains scarce.
New Construction: Limited and small format. Roughly 287,000 sq. ft. delivered in Q2 2026. The notable active projects are Huntington Gateway at 261,707 sq. ft., delivering March 2027, and South Coast Technology Center at 201,645 sq. ft., delivering August 2026, per Kidder Mathews.
Cap Rates: A Santa Ana multi-tenant industrial property traded at a 6.65% cap rate and $276.34 per sq. ft. in mid-2026, per Lee & Associates. Orange County pricing has repriced along with the wider region.
Lease Structure: Most properties operate under triple net leases (NNN) with annual escalations and limited tenant improvement allowances compared to the Inland Empire.
Tenants in Orange County value its proximity to major population centers, executive housing in areas like Newport Beach and Irvine, and coastal access—similar to the clustering advantages seen in Orange County’s office market. However, they often face higher lease rates, limited sublease options, minimal expansion flexibility, and stricter zoning regulations.
Why Orange County Commands Premium Rents
The county’s combination of high demand and fixed supply makes it one of the most resilient commercial real estate markets in California. Property owners and industrial property management firms benefit from:
- Annual lease escalations on existing leases, though new asking rents have declined
- Minimal tenant turnover and long-term lease stability
- High barriers to entry for new competition
- Premium location value near major business clusters
- Access to skilled workforce and executive talent
Comparative Snapshot: Side-by-Side Market Analysis
What This Means for Tenants: Choosing the Right Industrial Location
For occupiers and tenants, the Inland Empire offers affordability and availability, while Orange County provides prestige and proximity to key business centers and office and industrial space integration.
When to Choose the Inland Empire:
- You need 100,000+ sq. ft. of warehouse space or distribution facilities
- Your business prioritizes cost efficiency and lower operating expenses
- You require easy access to major ports (LA/Long Beach) and interstate highways
- You’re in e-commerce fulfillment, 3PL logistics, or large-scale distribution
- You want room for future expansion with flexible building size requirements
- You need high clear heights (32-40 feet) for modern racking systems
- You require cross-dock capabilities and multiple loading docks
- You prefer lower property tax rates and reduced total occupancy costs
When to Choose Orange County:
- You need executive accessibility and proximity to corporate headquarters
- Your products require shorter last-mile delivery to coastal markets
- You value brand prestige and professional image, particularly near key business clusters like Irvine Spectrum or South Coast Metro
- You’re in high-tech manufacturing, medical devices, aerospace, or specialized production
- Space requirements are under 50,000 sq. ft.
- You need proximity to skilled workforce and engineering talent
- You’re willing to pay premium rates for location advantages
- Your business benefits from being near complementary office space
Tenants should also plan for longer negotiation timelines and limited renewal flexibility in both markets, as both markets work through elevated availability. Working with an experienced tenant representation specialist can help secure favorable lease terms, better tenant improvement allowances, and optimal gross lease vs NNN structures.
Schedule a Tenant Consultation →
What This Means for Owners and Investors: Commercial Real Estate Portfolio Strategy
For property owners and real estate investors, both regions present opportunities but with very different risk profiles and return potential.
Inland Empire Investment Advantages:
- Higher going-in yields and a lower basis per sq. ft. than coastal submarkets, with recorded regional trades clearing between 5.26% and 6.65% in mid-2026
- A thinning construction pipeline supporting existing stock as current availability absorbs
- Scale opportunities with large-format assets and institutional-grade properties
- Infrastructure investments improving access, utilities, and transportation corridors
- Institutional investor interest providing exit liquidity and market depth
- Development opportunities with available land and supportive zoning regulations
- Value-add potential through property repositioning and modernization
Orange County Investment Advantages:
- Lower risk with minimal vacancy exposure and tenant stability
- Premium asset pricing and value retention through market cycles
- Long-term stability with credit tenants and extended lease terms
- Limited new supply protecting rent levels and market fundamentals
- Wealth preservation for conservative capital and 1031 exchange strategies
- Infill development potential for high-value, smaller-scale projects
- Tenant quality with established companies and lower default risk
Many sophisticated investors and commercial real estate brokers are diversifying portfolios to include both markets, leveraging the Inland Empire’s growth trajectory and Orange County’s resilience for balanced performance and risk-adjusted returns.
Looking to buy or sell industrial property? Contact our investment sales team for a confidential market analysis, property valuation, and strategic advisory services.
2026 Market Outlook: What to Expect
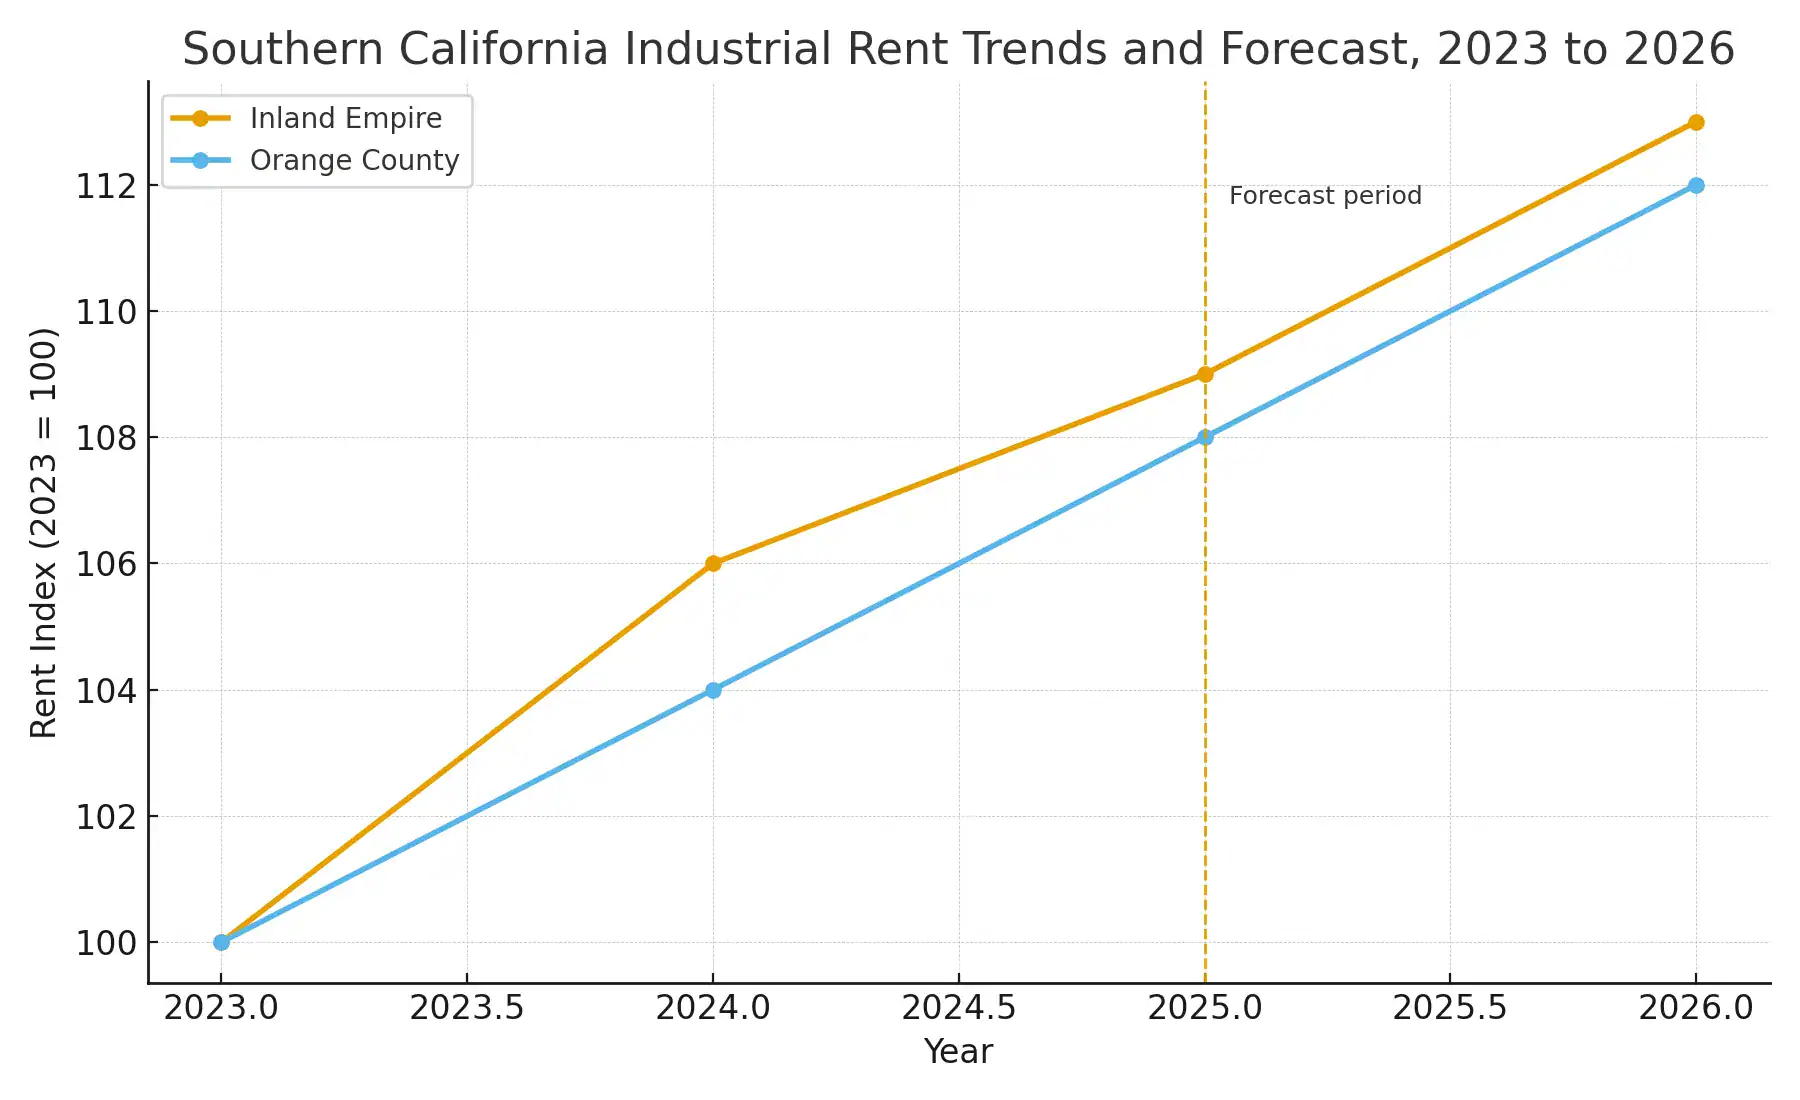
Asking rents declined across both markets through the first half of 2026. The more important variable ahead is supply: space under construction across Southern California fell 32.1% year over year to 15.5 million sq. ft., and quarterly deliveries fell 73.9%. That points to stabilization rather than continued decline.
Inland Empire Forecast:
- Vacancy should stabilize as the pipeline thins, with regional space under construction down 32.1% year over year (NAI Capital, Q2 2026)
- Leasing reached 25.7M sq. ft. year to date in the Inland Empire, though Q2 net absorption was negative 186,642 sq. ft. (Kidder Mathews, Q2 2026)
- Asking rents fell 4.7% year over year region-wide; stabilization is more likely than renewed growth in the near term (NAI Capital, Q2 2026)
- Development activity has slowed sharply, with only 296,000 sq. ft. delivered across the Inland Empire in Q2 2026 (Kidder Mathews)
- Increased competition may improve tenant improvement allowances
- Property tax rates remain competitive compared to coastal markets
Orange County Forecast:
- Asking rents fell 5.2% year over year and are more likely to stabilize than rise in the near term (Kidder Mathews, Q2 2026)
- Vacancy at 6.0% direct and drifting up, though structural land constraints still cap new supply (Kidder Mathews, Q2 2026)
- Minimal new construction except specialized build-to-suit projects and adaptive reuse
- Strong tenant retention with limited relocation options
- Continued landlord leverage in lease negotiations
- Premium pricing sustained by supply constraints and location value
Kidder Mathews Q2 2026 reports show the Inland Empire remains the region large-format logistics core at $0.98 per sq. ft. NNN, while Orange County holds its position as the most supply-constrained submarket at $1.45, a premium of roughly 48%.
Industrial Real Estate Trends Shaping Southern California
Several macro trends are influencing both markets and creating opportunities for tenants, owners, and commercial real estate investors:
E-commerce Evolution: While pandemic-era explosive growth has moderated, online retail continues driving demand for modern distribution space with high clear heights, cross-dock capabilities, and automated warehouse systems.
Office-to-Industrial Redevelopment: Obsolete suburban office campuses with sufficient acreage, freeway access and compatible zoning are being demolished for industrial product across the region. It is one of the few mechanisms adding genuinely infill industrial supply in constrained submarkets. We break down which sites qualify, and why electrical capacity now separates two very different building types, in Southern California Industrial Redevelopment.
Nearshoring & Reshoring: Companies bringing manufacturing back from overseas are seeking industrial space with manufacturing capabilities, adequate power infrastructure, and proximity to ports and transportation corridors.
Last-Mile Logistics: The push for faster delivery is increasing demand for smaller urban industrial facilities closer to population centers, particularly benefiting Orange County’s infill locations and multi-tenant flex space.
Sustainability Requirements: More tenants are seeking LEED-certified buildings, energy-efficient warehouse facilities, and properties with solar power capabilities to meet corporate ESG goals and reduce operating costs.
Automation & Technology: Modern tenants require higher clear heights (36+ feet), stronger floor loading capacity, and enhanced electrical systems to support robotics, automated storage and retrieval systems (AS/RS), and advanced warehouse management systems.
Cold Storage Demand: Growth in fresh food delivery and pharmaceutical logistics is driving demand for temperature-controlled facilities and cold storage warehouse space in both markets.
Flexible Lease Structures: More tenants are seeking shorter lease terms, flex space options, and hybrid arrangements combining office and industrial space to adapt to changing business needs.
Strategic Takeaways for Southern California’s Industrial Market
Industrial rents in Southern California have repriced downward since 2023, and the balance between affordability and accessibility remains key for both tenants and investors. The Inland Empire offers room to expand, stronger investment yields, and competitive warehouse leasing rates, while Orange County provides stable, premium locations for established tenants willing to pay for location advantages and brand positioning.
Whether you own, lease, or invest in commercial real estate, understanding how these two markets move together—and how they differ in terms of cap rates, tenant improvement allowances, zoning regulations, and property tax rates—helps you make strategic decisions that align with your business goals and financial objectives.
KEYZ Commercial continues to monitor regional trends, track new construction activity, analyze sublease space availability, and provide clients with expert guidance to achieve optimal results in today’s evolving industrial landscape.
Explore more Southern California market insights from KEYZ Commercial to stay ahead of regional trends, including our analysis of Orange County’s office cluster growth zones.
Frequently Asked Questions (FAQ)
Why are industrial rents higher in Orange County than in the Inland Empire?
Orange County industrial rents carry roughly a 48% premium over the Inland Empire: $1.45 versus $0.98 per sq. ft. per month NNN as of Q2 2026, per Kidder Mathews. The gap exists because Orange County has almost no developable land, restrictive zoning and very little large-format new construction, while offering last-mile proximity to dense coastal population centers and access to engineering and skilled manufacturing labor. That structural constraint has held the premium in place through multiple cycles. It has not made Orange County immune to the current softening: asking rents there fell 5.2% year over year and availability rose from 8.6% to 9.2% during the second quarter.
Is the Inland Empire still a good market for industrial tenants?
Yes. The Inland Empire remains one of the best options for industrial tenants who need larger spaces and cost efficiency. Asking rents have come down to $0.98 per sq. ft. per month NNN as of Q2 2026, and the region still offers better availability, more competitive pricing, lower property tax rates, and higher tenant improvement allowances than coastal markets. It is particularly attractive for logistics, e-commerce fulfillment, 3PL operations, and distribution users requiring modern facilities with high clear heights and cross-dock capabilities. With availability at 12.9%, tenants currently have more negotiating leverage than they did in 2024.
How do vacancy rates compare between the Inland Empire and Orange County?
As of Q2 2026, the Inland Empire direct vacancy rate is 7.6 percent, while Orange County is 6.0 percent, per Kidder Mathews. Availability, which counts space being marketed but not yet empty, is 12.9 percent in the Inland Empire against 9.2 percent in Orange County. Both figures rose over the prior quarter and both markets recorded negative net absorption in the second quarter, so conditions currently favor tenants more than they did a year ago. Orange County remains the tighter of the two markets.
What types of companies lease industrial space in these regions?
The Inland Empire is dominated by logistics operators, e-commerce fulfillment centers, third-party logistics (3PL) providers, manufacturing tenants, and distribution companies requiring large-scale warehouse facilities. Orange County attracts high-tech manufacturers, medical device companies, aerospace firms, specialized production facilities, and distribution users who value location and brand presence over cost savings. Many of these companies also maintain office space in Orange County’s key business clusters for their administrative and executive teams, creating integrated office and industrial space strategies.
What are cap rates for industrial properties in these markets?
Recorded Southern California industrial transactions cleared between roughly 5.26% and 6.65% in mid-2026, according to Lee & Associates investment data. A Santa Ana multi-tenant property traded at a 6.65% cap rate and $276.34 per square foot, while South Bay and Los Angeles assets cleared between 5.26% and 6.0%. Cap rates have widened substantially from the sub-5% pricing common in 2021 and 2022. Regionally, sale prices averaged $232 per square foot in Q2 2026, down 21.7% year over year, per NAI Capital.
What is the difference between NNN lease and gross lease structures?
A triple net lease (NNN) requires tenants to pay base rent plus property taxes, insurance and maintenance separately, which means the quoted rate understates total occupancy cost. A gross lease bundles those expenses into the base rent, making budgeting simpler. Most industrial space in both the Inland Empire and Orange County is quoted NNN, though some smaller Orange County buildings offer modified gross terms. When comparing a $0.98 Inland Empire quote against a $1.45 Orange County quote, confirm both are NNN and add estimated operating expenses to each before drawing a conclusion.
How can KEYZ Commercial help owners and tenants in these markets?
KEYZ Commercial provides full-service commercial real estate brokerage support, including tenant representation, landlord advisory, investment sales consulting, industrial property management referrals, and comprehensive market analysis. Our team of experienced commercial real estate brokers helps clients identify opportunities, negotiate favorable lease terms with optimal tenant improvement allowances, structure effective gross lease vs NNN arrangements, navigate zoning regulations, and position properties for maximum return in both the Inland Empire and Orange County markets.
Sources & References
This market analysis is based on data and research from the following authoritative sources:
- Kidder Mathews: Inland Empire Industrial Market Report, Q2 2026
- Kidder Mathews: Orange County Industrial Market Report, Q2 2026
- NAI Capital: SoCal Industrial Market Report, Q2 2026
- Lee & Associates: Southern California Industrial Investment Report, mid-2026
- City of Irvine: Development & Planning Reports
For the most current market data and custom analysis for your specific property needs, contact KEYZ Commercial.
Work With Southern California’s Industrial Real Estate Experts
KEYZ Commercial is a Southern California-based commercial real estate brokerage specializing in industrial, retail, office and industrial space, and investment properties. With deep local expertise, extensive market knowledge, and a client-first approach, the firm helps property owners, investors, tenants, and commercial real estate brokers navigate complex markets like the Inland Empire and Orange County to achieve their goals with confidence.
Whether you’re searching for warehouse space, looking to invest in industrial real estate, need strategic advice on your commercial property portfolio, require tenant representation services, or want to understand cap rates and investment returns, KEYZ Commercial delivers results-driven solutions tailored to your specific needs.
Our services include:
- Tenant Representation: Helping businesses find and negotiate optimal warehouse leasing rates and lease terms
- Landlord Services: Marketing properties, tenant screening, and lease negotiation
- Investment Sales: Buy-side and sell-side representation for commercial real estate investors
- Market Analysis: Comprehensive research on cap rates, rent trends, and market fundamentals
- Portfolio Strategy: Advisory services for property owners and institutional investors
📞 Contact KEYZ Commercial: hello@keyz.com | 888.539.9101 (KEYZ 101)
🌐 Visit: keyzcre.com
Schedule Your Free Consultation Today →
Related Resources:
- Orange County Office Cluster Growth Zones Analysis
- Browse Available Industrial Properties
- Learn About Our Services
- Read More Market Insights
Article published October 27, 2025. Fully revised August 6, 2026 with Q2 2026 market data from Kidder Mathews, NAI Capital and Lee & Associates. Author: KEYZ Commercial Real Estate Team.