
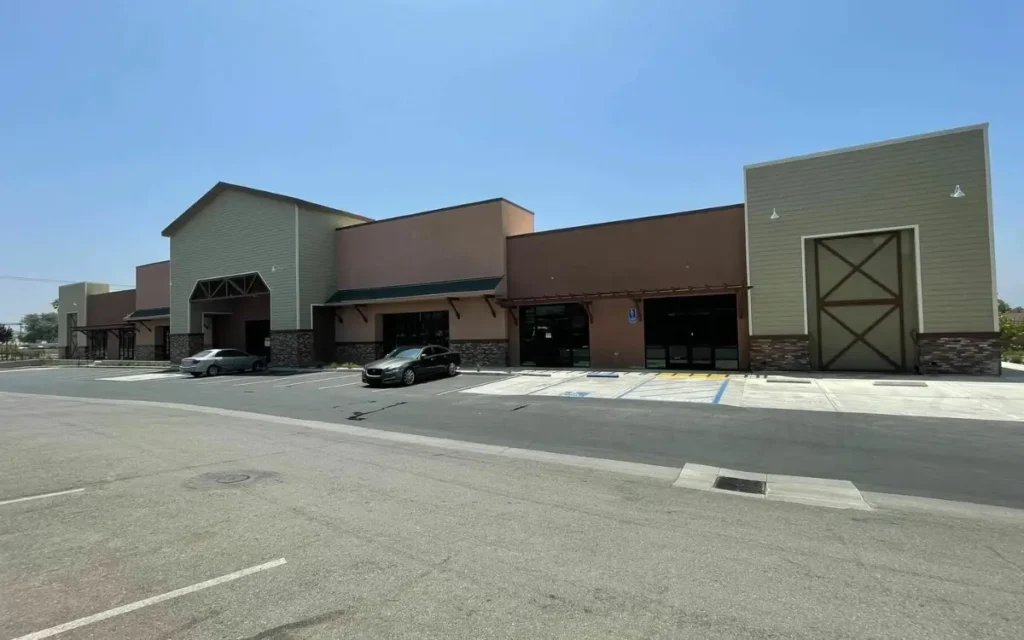
Jurupa Valley is a city of large households, steady growth and a big weekday workforce that lives somewhere else. Those three facts shape which retail concepts work here. This post sets out the US Census Bureau figures for the city, what they say about spending, how fast the city is really growing, and where the weekday industrial population comes in.
If you are already looking, see our Jurupa Valley retail space for lease for current availability at Limonite Plaza and Valley Square.
The trade area in numbers
| Measure | Jurupa Valley | Period |
|---|---|---|
| Population | 107,311 | 1 July 2025 estimate |
| Change since the April 2020 estimates base | 2.2% | 2020 to 2025 |
| Households | 28,053 | 2020 to 2024 |
| Persons per household | 3.78 | 2020 to 2024 |
| Median household income | $97,550 | 2020 to 2024, in 2024 dollars |
| Per capita income | $31,421 | 2020 to 2024, in 2024 dollars |
| Total retail sales | $1,271,017,000 | 2022 |
| Retail sales per capita | $11,866 | 2022 |
| Land area | 42.94 square miles | 2020 |
The household-size story
Three Census figures belong together: median household income of $97,550, per capita income of $31,421, and households averaging 3.78 people. Read as a set, they describe pooled household spending power rather than high individual discretionary spend.
That difference drives format. It favors volume and value: groceries, quick-service and family restaurants, discount retail, personal care, family medical and dental, and phone and financial services, over high-ticket discretionary goods. The City’s own pipeline is consistent with that. Grocery Outlet, Dollar Tree, Harbor Freight, Five Below and Daiso are all value operators, and all of them chose this city, as our look at the 2026 development pipeline shows.
If your concept serves a household of four doing a weekly shop, this trade area is built for you. If it depends on individual discretionary spend, read the two income figures again before you sign.
Growth, stated accurately
The Census Bureau puts population growth at 2.2% from the April 2020 estimates base to July 2025. That is steady, not explosive. The growth story is not the current headcount. It is the 5,947 homes on the City’s development map that are entitled or under construction and not yet lived in, roughly a 21% increase on today’s 28,053 households if they are all built. None of those homes appears in any published population figure yet.
The weekday population is industrial
Jurupa Valley sits on the Agua Mansa industrial corridor. The City’s map does not publish employment figures, so the honest proxy is building area, and the building area is large.
Industrial projects on the City map
| Project | Building area | Status |
|---|---|---|
| Agua Mansa Commerce Park | 4.2 million SF of logistics buildings, plus one more industrial building | Constructed |
| BRE Space Center | 2,112,112 SF (two new buildings totaling 1,939,312 SF plus an existing 172,800 SF building) | Constructed |
| Rubidoux Commerce Park | 1,355,040 SF in three buildings | Entitlements approved |
| Agua Mansa Road Development | 335,002 SF | Constructed |
| General Drive Industrial Park | 328,056 SF | Entitlements approved |
| Executive Coach | 86,000 SF manufacturing building | Entitlements approved |
| Inland Avenue Warehouse | 24,400 SF | Constructed |
| Total | More than 8.4 million SF | Across seven projects |
For a retailer that is a second customer base on a different clock: people who work in the city on weekdays but live elsewhere. Resident spend concentrates in evenings and weekends; worker spend is weekday and lunch hour. Decide which of the two your concept serves before you pick a corridor.
Two education projects are also in review. The Inland Empire Technical Trade Center proposes about 121,000 gross square feet across two academic buildings, with classrooms, labs, a multipurpose community room and dining space. The California-Nevada Joint Apprenticeship Training Committee proposes to expand its campus with a new 18,900 SF educational building. Neither is approved yet. If both are built, they would add weekday foot traffic of a kind the city does not have today.
Limonite and Mission: a trip or a stop
Our two centers sit on the two roads that carry much of the city’s day-to-day trade. Limonite Plaza is on Limonite Avenue, the same road as City Hall at 8930 Limonite Avenue. The City’s map also places an AutoZone at Limonite and Corey Street, the Canyon Terrace housing project at Camino Real and Limonite, and the approved Wineville Marketplace at Limonite and Wineville Avenue. Limonite Avenue continues east into Eastvale, so the corridor reaches beyond Jurupa Valley’s own households. Valley Square is on Mission Boulevard at Pyrite Avenue, the road where the City lists the Grace Vista affordable housing project.
The practical question for any operator is whether your customer is making a trip or making a stop. Destination concepts, where people plan the visit, care most about visibility and parking. Convenience concepts, where people stop on the way somewhere else, care most about being on the daily route. Walk both corridors at the hours you would be open before you choose.
A note on traffic counts
No public daily traffic counts exist for these corridors. The City of Jurupa Valley does not publish them, Riverside County’s count program covers unincorporated areas, and Caltrans covers state highways, so none of the three reaches Limonite, Mission, Van Buren, Rubidoux or Market. Any daily count you are quoted for these streets is an estimate, and it is fair to ask how it was produced.
Ready to look at sites? Read our zoning, CUP and planning checklist for Jurupa Valley first, then see the Limonite Plaza listing and the Valley Square listing.
Find the right space for your concept
KEYZ Commercial leases Limonite Plaza, including a second-generation restaurant space, and Valley Square. Tell us your size and use, or call 909-317-0300.
Sources
- US Census Bureau, QuickFacts, Jurupa Valley city, California, checked 19 October 2026. Population estimate 1 July 2025 (V2025); households, persons per household and income from the 2020 to 2024 American Community Survey, in 2024 dollars; retail sales from 2022; land area as of 2020.
- City of Jurupa Valley Community Development Department, Major Development Activity Map, read 19 October 2026 (last updated by the City on 4 September 2026). Building areas, unit counts and statuses are the City’s; totals are our sums.
- City of Jurupa Valley, Current Planning and Development Review, for the City Hall address, checked 19 October 2026.