

The Orange County retail market in Q2 2026
Orange County retail is the steadiest of the county's major property types, and the reason is supply. Almost nothing new gets built. Vacancy sits at 3.8%, and there are just 284,179 square feet under construction across the entire county. For scale, that is less new retail than a single regional mall.
That shapes how you should read every other number here. A 3.8% vacancy rate in a market with effectively no new supply behaves very differently from the same rate somewhere delivering square footage every quarter. When a good corner comes available in Orange County it is usually because a tenant failed, not because someone built something.
The softness, where there is any, shows up in absorption rather than vacancy. Q2 posted a healthy +240,744 square feet of net absorption, but the year to date is still −229,524 square feet, meaning the first half gave back more space than it took. Tenants are being replaced, but not instantly.
OC Retail Market at a Glance
- Retail vacancy
- 3.8% Up from 3.6% a year ago. ▲ 20 bps
- Asking rent
- $2.72 PSF/month, lease basis not stated. ▲ 1.6% YoY
- Average cap rate
- 4.9% Up from 4.6% a year ago. ▲ 30 bps
- Net absorption, Q2
- +241K SF Year to date still negative at −229,524 SF.
- Under construction
- 284K SF Countywide. ▲ 25.5% YoY
- Average sale price
- $572 PSF. ▲ 31.8% YoY. A mix shift, not a repricing.
Full-year context: deliveries year to date total 85,425 SF against 52,623 SF in the same period of 2025. Source: Kidder Mathews Research Group, Orange County Retail Market Report, Q2 2026. Kidder Mathews does not state a lease basis for its asking-rent figure. Updated quarterly.
Why you will see a different rent quoted elsewhere
If you have looked at more than one market report you will have noticed the numbers do not agree, and it is worth understanding why before you use any of them to price a deal.
| Source, Q2 2026 | Average asking rent | Lease basis | Vacancy / availability |
|---|---|---|---|
| Kidder Mathews | $2.72 PSF/mo | Not stated | 3.8% vacancy |
| CBRE | $2.55 PSF/mo | NNN | 3.7% availability |
Same county, same quarter, and the rents differ by 6.7%. The occupancy figures look almost identical, but they are not the same measurement. Kidder Mathews reports a vacancy rate: space sitting empty. CBRE reports an availability rate, which also counts occupied space that is being marketed. Two different metrics landing a tenth of a point apart is a coincidence, not a confirmation, and it tells you less than it appears to.
Some of it is a difference in what counts as retail inventory: minimum building size, whether enclosed malls and freestanding pads are included, and where the county boundary is drawn for edge submarkets. But part of it may simply be lease basis. CBRE labels its figure triple-net. Kidder Mathews does not say, and if its sample includes gross or modified-gross quotes, those carry occupancy costs inside the rent that a NNN quote charges separately. That alone can account for a spread of this size, which is a good reason to establish the basis of any number before you compare it to another one.
The two firms also describe movement differently. Kidder Mathews has vacancy rising, up 20 basis points from 3.6% a year earlier. CBRE has availability falling 20 basis points on the quarter. Different metrics, different comparison windows, so both can be true at once and neither settles the question. Nobody can tell you with confidence whether this market is tightening or loosening right now, and anyone who says otherwise is quoting one report.
The practical consequence: do not treat any county average as a target rent. Use it to understand direction and to sanity-check a quote that seems far outside the range. Price your actual deal off comparable transactions in your trade area, which is a different exercise entirely.
What the sales numbers are telling you
The two investment figures move in opposite directions and that is the most interesting thing in the table. Average sale price jumped 31.8% year over year to $572 per square foot, while cap rates widened 30 basis points to 4.9%.
Rising price alongside rising cap rate usually means the mix of what traded changed: larger, better-located, higher-income assets came to market rather than the whole market repricing upward. Read the $572 as a comment on what sold this year, not as a benchmark for your building. Underwrite your own rent roll.
Recent Orange County transactions
Orange County retail rarely sits on the open market long, so a public availability list tells you less here than it would elsewhere. These are recent assignments we completed in the county.
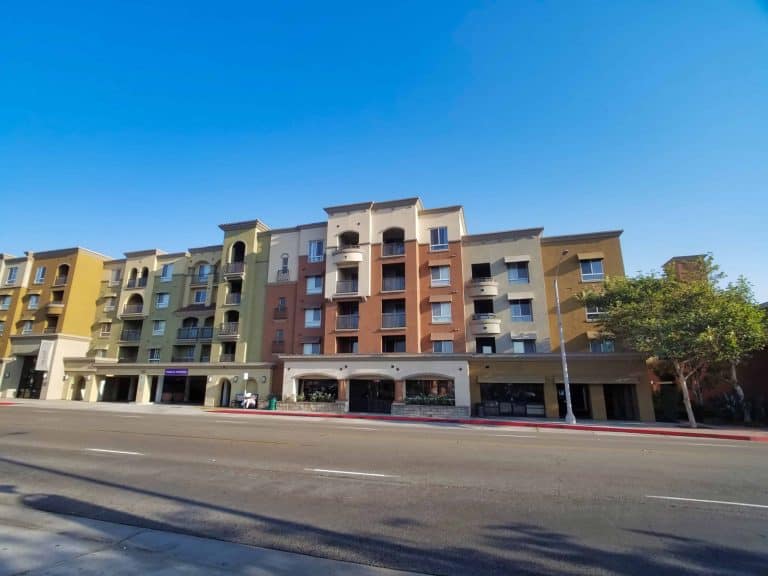
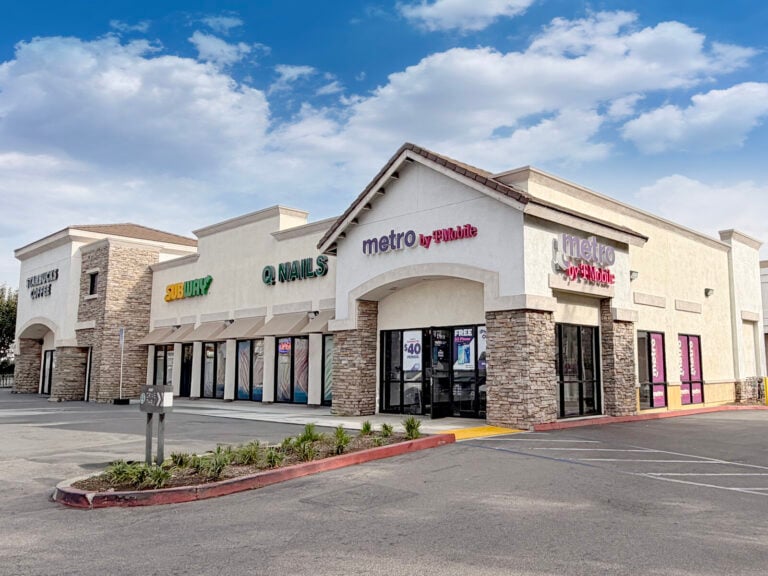
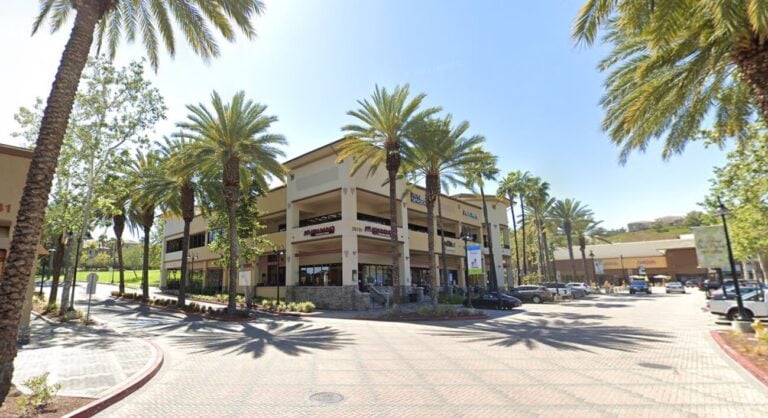
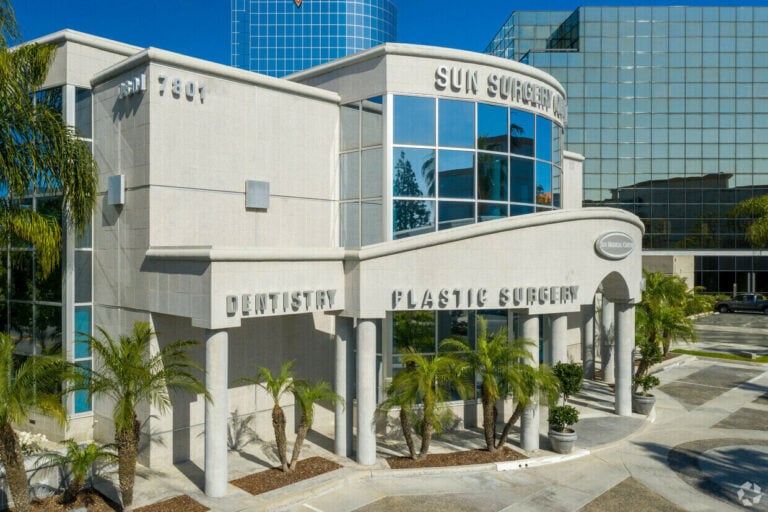
For current availability, tell us the trade area and the size you need. A meaningful share of what we transact never reaches the open market, and we will flag matching space before it lists.
If your trade area is flexible, we also lease across Los Angeles, Riverside, San Bernardino and Long Beach, where rents run materially lower for comparable trade-area quality. See all current listings, or call 1.888.KEYZ.101 and tell us the size and trade area you need.
How Orange County retail differs by city
"Orange County retail rent" is an average across 34 cities that trade very differently. A pad on Beach Boulevard in Huntington Beach and an inline suite on Harbor Boulevard in Santa Ana are not the same market and should never be priced against each other.
| City | Dominant product | Who leases here |
|---|---|---|
| Irvine | Master-planned centers | National inline, medical, fitness, QSR |
| Newport / coastal south | Lifestyle and specialty | Boutique, restaurant, personal service |
| Mission Viejo / South OC | Neighborhood and grocery-anchored | Daily needs, medical, fitness |
| Huntington Beach | Coastal and Beach Blvd corridor | Restaurant, surf/lifestyle, neighborhood |
| Brea | Regional draw, Brea Mall trade area | National inline, F&B, entertainment |
| Tustin | Neighborhood, grocery-anchored, Legacy district | Daily needs, service, QSR |
| Orange | Old Towne storefront, Tustin Ave corridor | Independent F&B, antique/specialty, service |
| Anaheim | Resort-adjacent, corridor inline, neighborhood | Hospitality-adjacent F&B, daily needs, service |
| Fullerton | Downtown storefront, Harbor corridor | Independent F&B, student-facing, service |
| Santa Ana | Dense urban inline, downtown, Bristol corridor | Independent retail, service, specialty grocery |
| Westminster / Garden Grove | Little Saigon, OC Koreatown, strip centers | Ethnic specialty retail and F&B, service |
Reading the table
The county-wide $2.72 average conceals a spread wide enough to change which business models work. A concept that pencils on a Westminster strip-center rent will not pencil in Irvine, and the same concept in Irvine gets a customer with materially higher household income. That trade-off, cost per square foot against spend per visit, is the actual decision, and no county average makes it for you.
One pattern worth knowing: south county rents more but turns over less. North and central county rents less, and the inventory moves. A tenant who needs space in ninety days has more options in Anaheim and Santa Ana than in Irvine or Aliso Viejo, almost regardless of budget.
We hold current asking rents and vacancy for every city above. Published quarterly reports cover Orange County as a single market and do not break down by city, so if you want the real number for a specific trade area, call us. That data does not exist in a public report.
What kind of retail space are you looking for?
Storefront and inline suites
The most common requirement we see, and the one where trade area matters more than anything on the rent schedule. In the Orange County centers we lease, inline suites run roughly 870 to 2,800 square feet and quote between $1.50 and $2.70 per square foot per month, with the spread driven by center quality, suite frontage and co-tenancy rather than by city.
The thing tenants underweight is co-tenancy. An inline suite next to a grocery anchor with a strong daily draw is a fundamentally different business than the same square footage in a center whose anchor box is dark. Ask what the anchor is, how long its lease runs, and what happens to your rent if it goes.
Small-format space under 1,000 square feet
There is real demand for very small retail in Orange County (service businesses, single-operator concepts, satellite locations) and very little purpose-built supply. Most of what exists is older strip centers and divided inline suites. If you need under 1,000 square feet, expect to pay a premium per foot, expect a shorter list, and expect to move quickly when something surfaces. Tell us your parameters and we will flag it when it comes up rather than after it lists.
Convenience stores and gas stations
This is a specialist market and it does not behave like general retail. Value is driven by fuel volume, inside sales, brand or dealer agreement, environmental condition and hours, not by rent per square foot. Comparable sales are thin, and a broker who prices one off a retail cap rate will get it wrong in both directions.
We transact in this niche regularly on both the lease and sale side across Orange County and the wider Southern California market. If you are buying, selling or leasing a c-store or fuel site, the diligence list is different and starts with the environmental file.
Restaurants, QSR and drive-thru pads
Restaurant space divides into second-generation and shell. Second-generation space, an existing restaurant with hood, grease interceptor, gas service and often a Type 41 or 47 license in place, carries a rent premium that is almost always cheaper than building the infrastructure yourself. Shell space looks cheaper per foot and rarely is.
Drive-thru pads are the scarcest product in Orange County retail. Municipalities have tightened approvals, existing pads rarely turn over, and when one does the competition is national. If a drive-thru is essential to your model, plan a longer search than you think you need.
Shopping centers and pads for sale
On the investment side, Orange County retail cleared at an average 4.9% cap rate in Q2 2026, up 30 basis points year over year, at an average $572 per square foot. Single-tenant net-leased product to national credit trades tighter than multi-tenant strip.
The buyer pool is deep and heavily 1031-driven, which means pricing can move on exchange deadlines rather than fundamentals. If you are selling into that, timing matters as much as the rent roll.
Leasing retail space in Orange County
What NNN actually costs you
Most retail in the county quotes NNN, meaning base rent plus your share of taxes, insurance and common area maintenance, but not all of it does. One of the centers we lease quotes industrial gross, where those costs already sit inside the rent. Confirm which you are being quoted before you compare two numbers, because they are not the same number.
Across the Orange County centers we lease, NNN charges have run between $0.60 and $1.26 per square foot per month on top of base rent, and the vintage of those numbers matters. The $0.60 comes from a 2021 lease and is almost certainly no longer achievable, given how much insurance and maintenance costs have moved since. The most recent figure we have is $1.26 at Los Alisos Village in Mission Viejo, quoted through August 2026, and it is an estimate rather than a reconciled number. Treat the top of that range as the realistic one. To make that concrete: the asking base rent on the available suite at that center is $3.75, so the NNN adds a third again on top, and the tenant writes a cheque for roughly $5.01 per foot. That means the $2.72 county average is not what you actually pay, and the gap is wide enough that a lower base rent can be the more expensive deal. Ask for the current figure on the specific suite, not the center.
Always get the current CAM estimate and the prior year's reconciliation in writing before signing. And read how CAM increases are capped. The difference between a cumulative and a non-cumulative cap compounds into serious money over a ten-year term. We wrote up the mechanics in cumulative vs. non-cumulative caps on operating expenses.
What is negotiable
- Tenant improvement allowance: the most movable term, especially on second-generation space that needs work to lease at all.
- Free rent: usually granted as a build-out period rather than a discount, and usually tied to term length.
- Exclusive use: often overlooked and worth more than a rent concession. Protects you from the landlord leasing to your direct competitor two doors down.
- Co-tenancy clauses: the right to rent relief or termination if the anchor goes dark. Hard to get, extremely valuable when the anchor is the reason you signed.
- Percentage rent breakpoints: where applicable, the breakpoint matters more than the percentage.
- Personal guaranty: frequently negotiable in duration and scope even when it cannot be removed entirely.
Mistakes that cost real money
- Signing without checking permitted use and parking. Orange County cities vary widely on what triggers a conditional use permit, and older centers are frequently parked below current code. A restaurant or fitness use can fail on parking ratio alone.
- Taking shell space to save on rent. The build-out on a restaurant shell routinely exceeds the rent differential over the whole term.
- Ignoring the anchor's lease expiry. If the anchor's term runs out before yours, you are exposed and you should be paid for it.
- Underwriting the seller's property tax on a purchase. Proposition 13 reassessment on transfer can multiply the tax line on a long-held Orange County asset. Model the reassessed number.
Working with us
KEYZ Commercial represents retail tenants, landlords, buyers and sellers across Orange County. On the tenant side the landlord pays the commission in the overwhelming majority of deals, and it is priced into the transaction whether or not you bring your own broker. Negotiating alone does not save the fee, it declines one already built in.
What representation changes is information: what the last three deals in the center actually closed at rather than what is being asked, which spaces are quietly available before they list, and which concessions this specific landlord has granted before.
More on tenant representation and landlord representation.
Frequently asked questions
What does retail space cost in Orange County?
Average asking rent across Orange County retail is $2.72 per square foot per month as of Q2 2026, up 1.56% year over year, with vacancy at 3.8%. That county-wide figure is not useful for underwriting a specific site, because the spread between Westminster and Irvine is wide enough to change which business models work, and on an NNN deal CAM adds further cost on top of base rent. Call us for the current number in a specific city.
Is there retail space for sale in Orange County?
Yes. Shopping centers, single-tenant net-leased pads, and owner-user storefront buildings all trade regularly. Q2 2026 saw an average cap rate of 4.9% at an average $572 per square foot, with net-leased national credit trading tighter than multi-tenant. The buyer pool is heavily 1031-driven, so pricing is sensitive to exchange timing as well as fundamentals.
Where can I find a convenience store or gas station for lease in Orange County?
Fuel and c-store product rarely appears on general listing platforms and is usually transacted through brokers who work the niche. Value depends on fuel volume, inside sales, brand agreement and environmental condition rather than rent per square foot. We handle these across Orange County, so call with your parameters and we will tell you what is actually available.
How small can retail space get in Orange County?
Suites under 1,000 square feet exist but are scarce and mostly in older strip centers. Expect a premium per square foot and a short list. If you need small-format space, register your requirement with us rather than watching listing sites. This size band moves before it publishes.
Which Orange County city has the cheapest retail rent?
Rents are generally lowest in the older north and central county corridors and highest in Irvine and the south county master-planned centers. We deliberately do not publish a rent figure per city, because no market report breaks Orange County down that way and any number we posted would be an estimate dressed as data. We hold the real figures from our own transactions and will give you the number for a specific trade area on a call. Cheapest is rarely the right question though. The relevant one is cost per customer in your trade area, and a lower rent in the wrong trade area is the more expensive mistake.
How long does it take to lease retail space in Orange County?
It varies more than most tenants expect, and the variance comes from tenant improvements and city permitting rather than from lease negotiation. The lease is rarely the long pole. Restaurant, and any use needing a conditional use permit, should assume the city's review cycle sets the schedule; start that conversation before you sign rather than after. Ask us for a timeline on the specific suite and the specific use. That is a question we can answer precisely, and a generic county-wide number would only mislead you.
Retail by city
Every Orange County market we cover has its own page with local availability, zoning and leasing detail.
- Aliso Viejo
- Anaheim
- Brea
- Buena Park
- Costa Mesa
- Cypress
- Dana Point
- Fountain Valley
- Fullerton
- Garden Grove
- Irvine
- La Habra
- La Palma
- Laguna Beach
- Laguna Hills
- Laguna Niguel
- Laguna Woods
- Lake Forest
- Los Alamitos
- Mission Viejo
- Orange
- Rancho Santa Margarita
- San Clemente
- San Juan Capistrano
- Santa Ana
- Seal Beach
- Stanton
- Tustin
- Villa Park
- Westminster
- Yorba Linda
Other property types
- Orange County flex space
- Orange County office space
- Huntington Beach office space
- Placentia office space
- Cerritos flex and industrial
- State Road flex, Cerritos
Nearby markets outside Orange County
- Cerritos retail (LA County)
- Lakewood retail (LA County)
- Corona retail (Riverside County)
- Jurupa Valley retail (Riverside County)
Wider market guides
- Santa Ana commercial real estate
- Garden Grove commercial real estate
- Cerritos commercial real estate
- Los Angeles commercial real estate, if your search extends north
Related reading: the Brea Mall redevelopment, a case study in how experiential and residential uses are being layered into Southern California retail, and Southern California industrial redevelopment.
Looking for retail space in Orange County?
Tell us the trade area, the size and the use. We will tell you what is available, what the last comparable deal actually closed at, and what is worth negotiating.
Call 1.888.KEYZ.101 or browse current listings.
Sources & references
This market analysis draws on data and research from the following sources:
- Kidder Mathews Research Group, Orange County Retail Market Report, Q2 2026
- CBRE, Orange County Retail Figures, Q2 2026
- KEYZ Commercial transaction and listing data, Orange County, 2026
Figures are indicative of market conditions as of Q2 2026 and are not a substitute for property-specific analysis. Availability is subject to change. For current market data and analysis on a specific property, contact KEYZ Commercial.